Related services: management dashboard development
Why Businesses Invest in Excel Dashboards
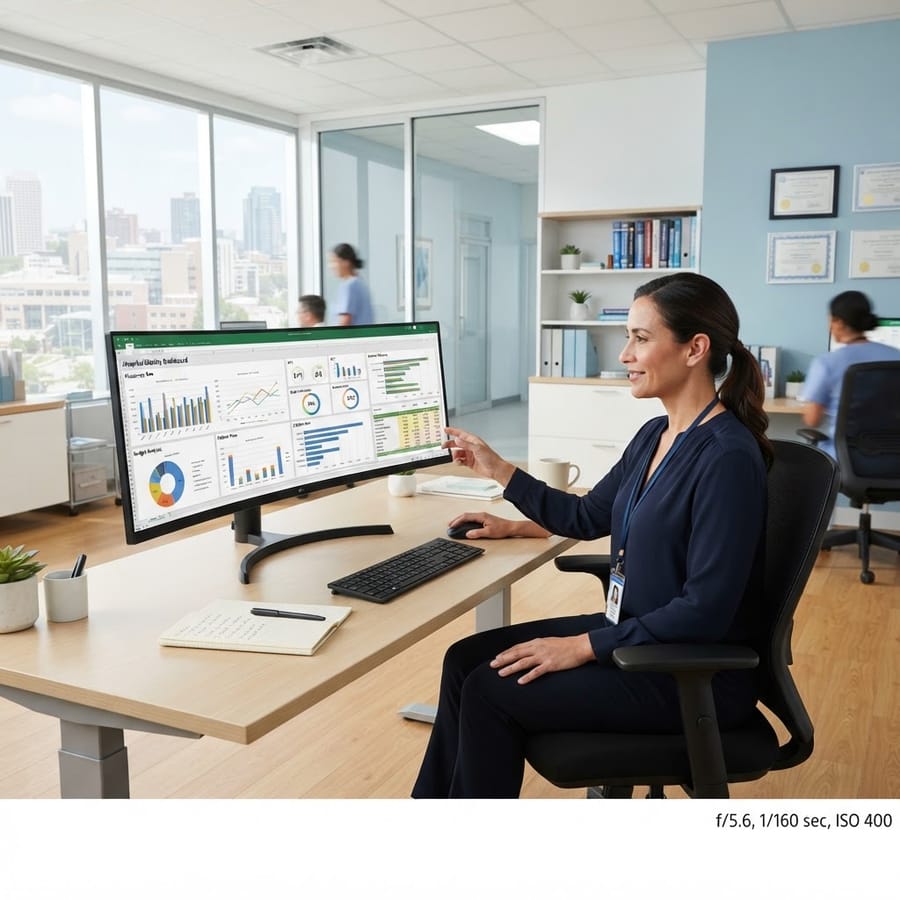
Most businesses accumulate data across multiple systems — accounting software, CRM platforms, operational databases, and spreadsheets. Without a consolidated view, managers spend time chasing information rather than acting on it. A professionally built Excel dashboard brings that data together into a single, automatically updating interface that gives decision-makers immediate visibility over the metrics that matter.
For many New Zealand organisations, building dashboards in Excel is more practical than investing in a full business intelligence platform. The data already exists in Excel-compatible formats, the tool is already licensed and familiar to staff, and a well-built dashboard can deliver the same executive visibility at a fraction of the cost.
What Makes a Good Excel Dashboard
- Loads and refreshes automatically from source data
- Presents the right metrics for the intended audience
- Uses clear, consistent visual hierarchy
- Avoids unnecessary complexity and visual clutter
- Protects source data from accidental changes
- Works reliably across different users and machines
- Scales as the business and data grow
Types of Dashboards We Build
XLS Experts builds operational dashboards, financial performance dashboards, sales and revenue dashboards, project status trackers, workforce and resource planning views, KPI scorecards, and executive summary reports. Each is designed for a specific audience and purpose rather than being a generic template.
Connecting Dashboards to Live Data
Modern Excel dashboards do not require manual data entry. Power Query enables automatic import from SQL databases, CSV files, SharePoint lists, web sources, and other business systems. Charts and pivot tables update automatically when source data refreshes, meaning reports that previously took hours to prepare can be ready in seconds.
Frequently Asked Questions
- Can Excel dashboards connect to live databases?
- Yes. Power Query and VBA can connect Excel dashboards directly to SQL databases, enabling reports to refresh automatically from live business data.
- How long does a dashboard project take?
- Simple dashboards with defined requirements can be delivered in one to two weeks. More complex executive reporting environments with multiple data sources typically take three to five weeks.
- Is Excel or Power BI better for dashboards?
- It depends on the audience and infrastructure. Excel is often better when users need to interact with data directly or the business already uses Excel heavily. Power BI is better when the primary need is visualisation for a read-only audience.
Conclusion
A professionally built Excel dashboard delivers clarity, speed, and confidence to business decision-making. For New Zealand businesses that already run on Excel, it is often the fastest path to better reporting without the cost and complexity of enterprise BI software. XLS Experts designs and builds dashboards tailored to the specific people, data, and decisions in your organisation.