Improve Financial Planning with Excel Budget Dashboards in NZ
- Mathew
- 2 days ago
- 5 min read
Financial planning has become increasingly complex for organisations across New Zealand. Rising operational costs, fluctuating market conditions, and growing pressure on financial transparency require businesses to make faster and more informed budgeting decisions. However, many organisations still rely on disconnected spreadsheets, manual reporting processes, and static financial reports that limit visibility and delay decision-making.
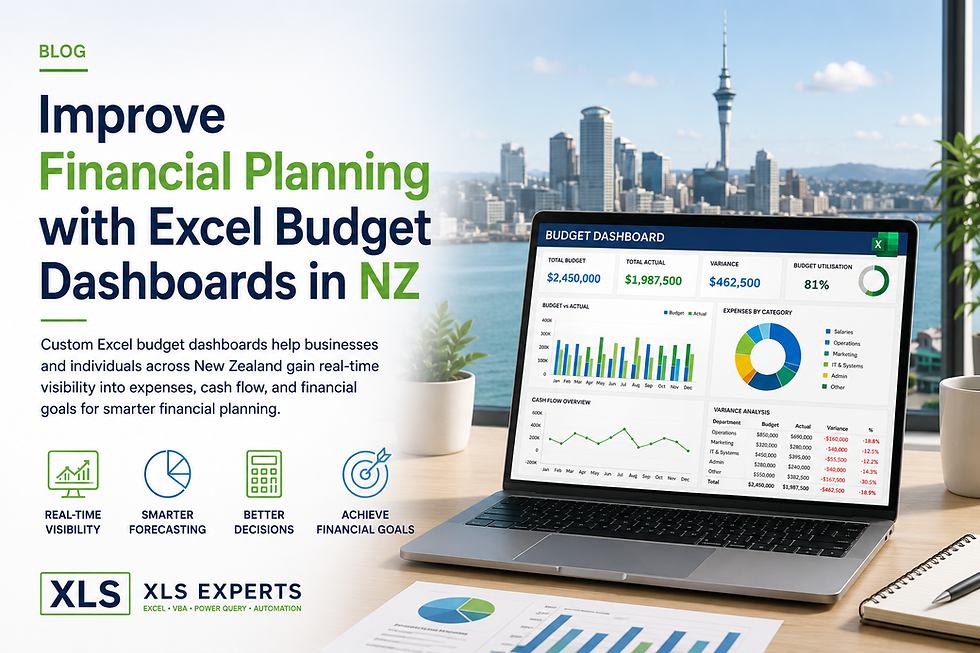
Custom Excel budget dashboards provide a practical and scalable solution for improving financial planning, forecasting accuracy, and operational control. When designed correctly, Excel evolves from a simple spreadsheet tool into a powerful financial management platform capable of delivering enterprise-grade reporting, automation, and real-time analysis.
As businesses across New Zealand continue to seek cost-effective alternatives to expensive ERP customisation projects, Excel budget dashboards are increasingly being used to bridge reporting gaps, automate financial workflows, and improve strategic planning outcomes.
Why Financial Planning Challenges Persist in Modern Organisations
Many finance teams struggle with common operational challenges that affect budgeting accuracy and reporting efficiency, including:
Multiple versions of budget files across departments
Manual consolidation of financial data
Delayed reporting cycles
Limited visibility into cash flow and spending trends
Inconsistent forecasting methodologies
High risk of spreadsheet errors
Difficulty integrating operational and financial data
These issues become more significant as organisations scale. Finance leaders require reliable and auditable systems that support decision-making without introducing unnecessary complexity or software overhead.
While enterprise ERP platforms provide core transactional capabilities, they often lack the flexibility required for customised budgeting, forecasting, and management reporting. This is where advanced Excel dashboards deliver substantial value.
What Is an Excel Budget Dashboard?
An Excel budget dashboard is a customised financial reporting interface built within Microsoft Excel using technologies such as:
Excel formulas and modelling
VBA automation
Power Query
Power Pivot
Interactive charts and visualisations
ERP and database integrations
These dashboards centralise financial information into a single reporting environment, enabling organisations to monitor:
Budget performance
Department expenditure
Revenue trends
Cash flow forecasts
Financial KPIs
Variance analysis
Scenario modelling
Rather than manually preparing multiple reports, finance teams can access dynamic and interactive dashboards that automatically refresh data and provide real-time financial insights.
How Excel Budget Dashboards Improve Financial Planning
Real-Time Visibility into Financial Performance
One of the most significant advantages of Excel budget dashboards is immediate access to current financial data.
Instead of waiting for month-end reporting cycles, finance leaders can monitor budget utilisation, expenditure trends, and operational performance continuously. This supports faster intervention when costs exceed expectations or revenue forecasts change.
Interactive dashboards also allow users to drill down into specific business units, departments, projects, or cost centres, improving financial accountability across the organisation.
Why Is Real-Time Budget Visibility Important?
Real-time visibility helps organisations:
Detect overspending earlier
Improve cash flow management
Reduce reporting delays
Support proactive decision-making
Improve forecast accuracy
Align operational spending with strategic objectives
For enterprise organisations operating across multiple teams or locations, these capabilities are essential for maintaining financial control.
Improved Forecasting Accuracy
Traditional budgeting methods often rely on static assumptions and manual calculations that become outdated quickly.
Excel dashboards improve forecasting by integrating live operational and financial data into forecasting models. Businesses can use automated calculations and scenario modelling to evaluate:
Revenue projections
Seasonal demand fluctuations
Cost increases
Staffing impacts
Project investment outcomes
Cash reserve requirements
This allows finance teams to move from reactive budgeting toward forward-looking financial planning.
How Does VBA Automation Support Financial Planning?
Excel VBA automation significantly reduces manual effort within budgeting processes.
VBA can automate:
Monthly report generation
Data imports from ERP systems
Budget consolidation
Variance reporting
Approval workflows
Forecast updates
Dashboard refresh processes
Automation reduces human error while improving reporting consistency and governance.
For organisations with complex reporting requirements, VBA enables the creation of controlled and repeatable financial processes without requiring expensive software redevelopment.
Centralised Financial Reporting Across Departments
Many organisations struggle with inconsistent reporting structures across departments.
Custom Excel budget dashboards standardise reporting methodologies and provide a single source of truth for financial data. This improves collaboration between finance, operations, executive leadership, and project management teams.
Centralised dashboards also support:
Executive reporting
Board reporting
Department accountability
Financial governance
Audit readiness
By consolidating reporting into a governed framework, organisations reduce the operational risk associated with fragmented spreadsheets.
Integration with ERP and Business Systems
Modern Excel solutions can integrate directly with enterprise systems and databases.
Using Power Query, APIs, VBA, and SQL connectivity, Excel dashboards can retrieve data from:
ERP systems
Accounting platforms
CRM systems
Payroll software
Inventory systems
Data warehouses
Cloud-based reporting environments
This integration capability allows organisations to maintain the flexibility of Excel while leveraging enterprise-grade data sources.
For many New Zealand businesses, this provides a highly cost-effective alternative to custom ERP reporting development.
Why Do Organisations Choose Excel Instead of ERP Customisation?
ERP customisation projects are often expensive, time-consuming, and difficult to maintain.
Excel dashboards provide several advantages:
Excel Budget Dashboards | ERP Customisation |
Faster implementation | Longer deployment cycles |
Lower development costs | Higher consulting costs |
Flexible reporting design | Rigid reporting structures |
Easier user adoption | Extensive training requirements |
Rapid updates and enhancements | Slower change management |
For many organisations, Excel functions as a strategic reporting layer that complements existing enterprise systems rather than replacing them.
Governance and Risk Reduction in Excel Reporting
Poorly designed spreadsheets create operational risk. However, professionally developed Excel dashboard systems can include governance controls that improve reliability and maintainability.
These controls may include:
Locked calculation structures
Role-based access controls
Validation rules
Automated error checking
Controlled input forms
Audit tracking
Standardised reporting templates
When developed by experienced Excel specialists, dashboards become stable business applications rather than unmanaged spreadsheets.
How Can Excel Dashboards Support Executive Decision-Making?
Executives require concise and accurate financial information to support strategic planning.
Excel dashboards simplify complex financial datasets into clear visual reporting formats that enable leadership teams to quickly identify:
Budget variances
Profitability trends
Operational inefficiencies
Cash flow risks
Investment opportunities
Resource allocation priorities
This improves decision-making speed while reducing dependence on manually prepared reports.
Common Use Cases for Excel Budget Dashboards in NZ
Businesses across New Zealand use Excel dashboards for a wide range of financial
planning applications, including:
Corporate Budget Management
Track organisational budgets across multiple departments and reporting periods.
Project Financial Tracking
Monitor project expenditure, resource allocation, and profitability.
Cash Flow Forecasting
Analyse incoming and outgoing cash movements with rolling forecasts.
Operational Reporting
Consolidate operational and financial KPIs into unified dashboards.
Management Reporting
Provide executives and stakeholders with automated reporting packs.
Scenario and Sensitivity Analysis
Evaluate potential financial outcomes under different business conditions.
What Should Organisations Look for in an Excel Dashboard Partner?
Not all Excel development approaches deliver long-term value.
Organisations should seek partners that understand:
Financial modelling principles
Enterprise governance requirements
VBA and Power Query automation
Data integration architecture
Reporting scalability
Maintainability and documentation
Business process optimisation
The objective is not simply to build spreadsheets, but to develop reliable financial systems that improve operational performance and strategic decision-making.
Why XLS Experts Is a Trusted Partner for Excel Financial Solutions in NZ
XLS Experts NZ specialises in professional Excel automation, VBA development, Power Query solutions, and enterprise reporting systems for organisations across New Zealand and internationally.
The team delivers tailored financial dashboard solutions designed to:
Improve reporting efficiency
Reduce manual processing
Enhance forecasting accuracy
Strengthen governance
Integrate with existing systems
Support scalable financial operations
From enterprise-grade reporting platforms to practical SME budgeting solutions, XLS Experts develops structured Excel systems that align with real business objectives.
Conclusion
Financial planning requires accurate data, timely reporting, and reliable forecasting processes. Organisations that continue to depend on fragmented spreadsheets and manual budgeting workflows face growing operational and financial risks.
Custom Excel budget dashboards provide a powerful solution for improving visibility, automating reporting, and strengthening financial decision-making across the organisation.
With the right architecture, governance, and automation strategy, Excel becomes a highly effective enterprise reporting and financial planning platform capable of supporting both operational efficiency and strategic growth.
For businesses in New Zealand seeking flexible, scalable, and cost-effective financial reporting solutions, professionally developed Excel dashboards offer substantial long-term value.


Comments