Related services: Excel financial modelling services · purpose-built Excel workbooks
Introduction
Infrastructure projects across New Zealand involve complex coordination between engineering teams, contractors, procurement departments, and project management offices. From transportation upgrades and water systems to large-scale commercial developments, project leaders must monitor budgets, timelines, contractor performance, and resource allocation continuously.
However, many organisations still rely on fragmented spreadsheets, static reports, or delayed data updates. This makes it difficult for project managers and executive stakeholders to gain a clear, real-time view of project performance.
Excel dashboards for infrastructure project monitoring provide a powerful and practical solution. When professionally designed using advanced Excel, VBA automation, and structured data models, dashboards transform raw project data into clear visual intelligence.
For infrastructure organisations in New Zealand, these dashboards allow leadership teams to monitor progress, identify risks early, and make faster, more informed decisions.
Why Infrastructure Projects Need Real-Time Monitoring
Large infrastructure projects generate enormous amounts of operational data. This includes:
- Project schedules
- Cost tracking and budget forecasts
- Resource allocation
- Contractor performance metrics
- Risk registers
- Procurement tracking
Without a consolidated monitoring system, project teams often struggle with:
- Delayed reporting cycles
- Manual spreadsheet updates
- Inconsistent data across departments
- Limited visibility for senior leadership
- Increased risk of cost overruns or delays
An Excel infrastructure dashboard solves these challenges by centralising project data into a single, structured reporting interface.
What Is an Excel Infrastructure Project Dashboard?
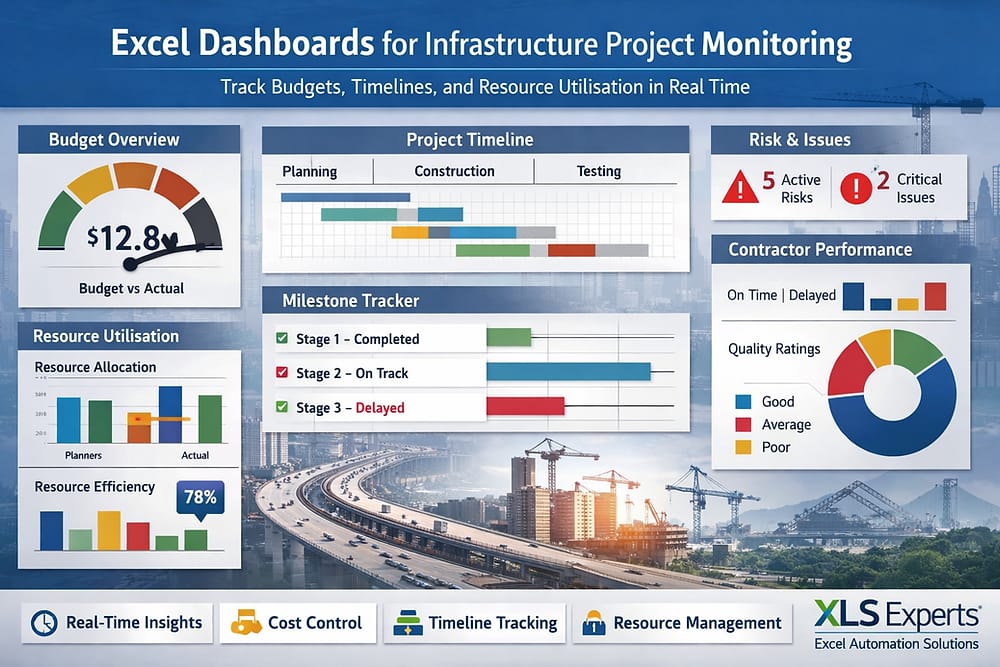
An Excel dashboard for project monitoring is a structured reporting system that consolidates multiple data sources into visual performance indicators.
These dashboards typically include:
- Budget tracking and cost variance charts
- Project milestone progress
- Resource utilisation metrics
- Risk and issue monitoring
- Contractor performance indicators
- Timeline and schedule tracking
Instead of manually compiling reports each week, Excel dashboards automatically update key metrics, providing stakeholders with a real-time overview of project performance.
For project management offices (PMOs) and engineering leadership, this means faster access to reliable information.
How Excel and VBA Enable Advanced Project Monitoring
Excel is widely used in engineering, construction, and infrastructure management because it combines accessibility with powerful analytical capabilities.
When enhanced with VBA automation and advanced Excel modelling, dashboards become fully operational project monitoring tools.
Key Capabilities Include
1. Automated Data Integration
Project data can be imported automatically from multiple sources, such as:
- ERP systems
- Financial reporting systems
- contractor spreadsheets
- procurement databases
Automation eliminates manual copy-paste processes and improves reporting accuracy.
2. Real-Time Budget Monitoring
Infrastructure budgets are dynamic and require continuous oversight.
Excel dashboards allow project managers to track:
- planned vs actual expenditure
- cost forecasts
- budget variance
- contingency utilisation
Visual indicators quickly highlight financial risks before they escalate.
3. Milestone and Schedule Tracking
Project timelines are critical in infrastructure delivery.
Excel dashboards can automatically display:
- milestone completion status
- schedule delays
- critical path monitoring
- project phase progress
This allows leadership teams to identify bottlenecks early and allocate resources accordingly.
4. Resource and Workforce Monitoring
Infrastructure projects involve engineers, contractors, suppliers, and technical specialists.
Excel dashboards help monitor:
- workforce allocation
- contractor productivity
- equipment utilisation
- task completion rates
With visual insights, project managers can optimise workforce deployment.
Why Excel Is Still a Strategic Tool for Infrastructure Reporting
Many organisations assume that ERP or specialised project management software should handle all reporting needs. However, large systems are often expensive to customise and slow to adapt.
Excel offers several advantages in infrastructure environments.
Flexibility
Infrastructure projects frequently evolve as regulatory requirements, budgets, and engineering constraints change. Excel dashboards can be quickly adapted without lengthy software development cycles.
Cost Efficiency
Custom ERP reports or BI tools may require significant investment and IT resources. Excel automation allows organisations to build powerful reporting systems at a fraction of the cost.
Accessibility
Project managers, engineers, finance teams, and executives already use Excel daily. This ensures that dashboards are accessible without additional training.
Integration Capability
Advanced Excel systems can integrate with existing platforms such as:
- ERP systems
- project management software
- procurement systems
- financial reporting platforms
This enables Excel to act as a central reporting layer for infrastructure monitoring.
What Role Does VBA Automation Play?
While standard spreadsheets are useful, complex infrastructure dashboards require automation to maintain reliability and scalability.
VBA (Visual Basic for Applications) enables Excel systems to behave like enterprise applications.
Automation can support:
- automated report generation
- scheduled data refresh
- structured data validation
- controlled user workflows
- dashboard refresh with a single click
For organisations managing multiple projects simultaneously, VBA ensures consistent and accurate reporting.
How an Excel Expert Designs Enterprise-Grade Dashboards
Developing a professional infrastructure dashboard requires more than spreadsheet formulas.
Experienced Excel consultants design dashboards with enterprise governance and system reliability in mind.
This includes:
Structured Data Architecture
Clean and structured data models ensure dashboards remain stable even as projects scale.
Performance Optimisation
Large infrastructure datasets can slow down poorly designed spreadsheets. Expert development ensures efficient calculations and fast reporting.
Error Reduction
Automated validation rules prevent incorrect data entry and maintain data integrity.
Auditability
Properly designed dashboards maintain transparent calculations and traceable reporting logic, supporting governance and compliance requirements.
What Business Outcomes Can Infrastructure Teams Expect?
When implemented correctly, Excel dashboards deliver measurable operational benefits.
Improved Decision-Making
Leadership teams gain a clear, real-time overview of project performance.
Faster Reporting Cycles
Automated dashboards replace manual report preparation.
Better Budget Control
Cost variances and financial risks become visible earlier.
Increased Project Transparency
Stakeholders across engineering, finance, and operations can access consistent reporting.
Reduced Administrative Work
Automation eliminates repetitive spreadsheet tasks.
How XLS Experts Supports Infrastructure Organisations in New Zealand
XLS Experts specialises in developing enterprise-grade Excel automation solutions for infrastructure, engineering, and operations teams.
Their expertise includes:
- advanced Excel dashboard development
- VBA automation systems
- Power Query data integration
- large-scale reporting tools
- enterprise Excel applications
Instead of relying on fragmented spreadsheets, organisations gain structured, maintainable Excel systems designed for operational reliability.
These solutions allow project managers, engineers, and executives to focus on delivering infrastructure outcomes rather than managing spreadsheets.
Conclusion
Infrastructure projects require precise coordination, financial oversight, and transparent reporting. Without a structured monitoring system, organisations risk delays, cost overruns, and operational inefficiencies.
Excel dashboards powered by VBA automation provide a practical and scalable solution for infrastructure project monitoring. By transforming complex project data into clear visual insights, organisations can improve decision-making, enhance financial control, and ensure projects remain on track.
For infrastructure organisations in New Zealand seeking reliable reporting systems, partnering with experienced Excel specialists such as XLS Experts ensures dashboards are designed with the governance, scalability, and automation required for enterprise environments. 📊🏗️