Related services: Excel dashboard development
Introduction
Modern businesses generate vast amounts of operational, financial, and performance data every day. However, many organisations across New Zealand still struggle to convert that information into actionable insights quickly and consistently. Data is often fragmented across multiple systems, spreadsheets, and reporting processes, creating delays, manual errors, and limited visibility for decision-makers.
Custom Excel dashboards provide a practical and highly effective solution for organisations seeking real-time reporting, KPI visibility, and data-driven decision-making without the cost and complexity of large-scale software redevelopment. When designed correctly, enterprise-grade Excel dashboards become strategic reporting tools that improve governance, forecasting, operational efficiency, and executive visibility.
Why Businesses Need Better Reporting Visibility
Many organisations face common reporting challenges: data spread across multiple departments and systems, manual consolidation of reports, inconsistent KPI calculations, slow month-end reporting cycles, limited visibility into operational performance, high dependency on key staff members, and increased risk of spreadsheet errors. As businesses grow, these reporting inefficiencies create operational bottlenecks and reduce confidence in decision-making.
What Is an Excel Dashboard?
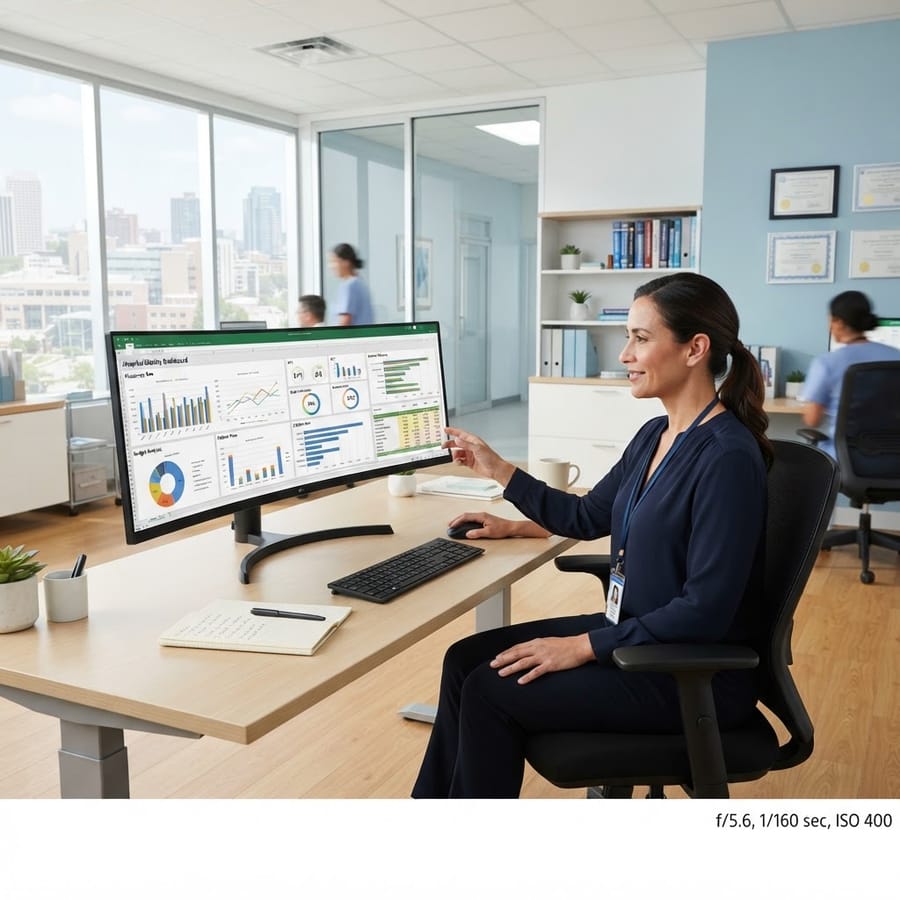
An Excel dashboard is an interactive reporting interface that consolidates business data into visual summaries, charts, KPIs, and analytical tools. Modern Excel dashboards often include automated data imports, live KPI tracking, financial reporting summaries, operational analytics, forecasting models, interactive filters and drill-down functionality, ERP and database integration, and VBA-powered automation workflows.
How Excel Dashboards Improve Business Decision-Making
Real-Time Access to Critical Business Metrics
Decision-makers require timely access to accurate information. Custom Excel dashboards automate data refreshes and consolidate information from multiple sources, enabling businesses to monitor revenue performance, operational efficiency, project delivery status, inventory movement, budget vs actual performance, customer trends, and workforce productivity.
Reducing Reporting Errors and Risk
Professionally developed dashboards reduce risk through standardised calculations, automated workflows, controlled data structures, validation rules, audit-friendly reporting processes, and reduced manual intervention — essential for NZ businesses operating in regulated industries or managing large operational datasets.
Why Excel Remains a Powerful Enterprise Reporting Platform
Excel dashboards provide a flexible reporting layer that integrates with existing systems while avoiding unnecessary ERP redevelopment costs. This allows businesses to extend the value of existing systems, build tailored operational reporting, improve management visibility, deliver faster reporting outcomes, and adapt quickly to changing business requirements. Advanced Excel dashboards can integrate with ERP platforms, accounting systems, SQL databases, cloud applications, SharePoint environments, and API-based systems.
Common Business Use Cases for Excel Dashboards
Finance teams use dashboards to monitor profitability, cash flow, budget performance, forecast accuracy, departmental expenditure, and variance analysis. Operations teams track resource utilisation, service delivery metrics, production performance, project milestones, supply chain activity, and asset performance. Executive dashboards consolidate metrics from multiple departments into a single reporting environment for leadership teams.
How VBA Automation Enhances Excel Dashboards
Excel VBA automation reduces manual workload by automating data imports, report generation, formatting, distribution workflows, validation checks, and scheduled updates — significantly improving reporting consistency while reducing administrative overhead. Professionally developed VBA-driven solutions improve reporting reliability, scalability across teams, long-term maintainability, user experience, and process standardisation.
Frequently Asked Questions
- Are Excel dashboards suitable for enterprise organisations?
- Yes. When professionally developed, Excel dashboards can support enterprise-grade reporting requirements, including automation, governance, auditability, and integration with business systems.
- Can Excel dashboards connect to ERP systems?
- Yes. Excel dashboards can integrate with ERP platforms, databases, accounting systems, and cloud applications using Power Query, VBA, APIs, and structured data connections.
- Why use Excel instead of a full BI platform?
- Excel offers flexibility, lower implementation costs, rapid deployment, and compatibility with existing business processes. For many NZ organisations, it provides a practical balance between capability and cost efficiency.
- Are Excel dashboards scalable?
- Professionally designed dashboard systems can scale across departments, reporting teams, and business units while maintaining reporting consistency and governance controls.
Conclusion
Custom Excel dashboards help businesses across New Zealand convert complex operational data into meaningful business insights. Through automation, KPI visibility, and integrated reporting, organisations can improve decision-making speed, reduce reporting risk, and enhance operational efficiency. When combined with VBA automation, Power Query, and structured reporting frameworks, Excel becomes a powerful enterprise reporting platform capable of supporting strategic business operations at scale. XLS Experts delivers professional Excel dashboard, VBA automation, and reporting solutions designed to help NZ organisations streamline operations, improve visibility, and make smarter business decisions with confidence.